Go further with iLearnVibration [Professional]
iLearnVibration [Professional] adds four integrated modules to the iLearnVibration [Standard] package. These modules help you: gain measurement and analysis experience, understand machine frequencies, and understand your data collector functions. This is our most commonly ordered package.
Note: iLearnVibration is an integrated software program. When you order iLearnVibration [Standard] the application has a single tab to access the training. When you order iLearnVibration [Professional] you have five tabs, to access the training and four new modules, described below.
 Case histories build experience and confidence Case histories build experience and confidence
The only way to become experienced and confident with vibration analysis is to try it yourself.
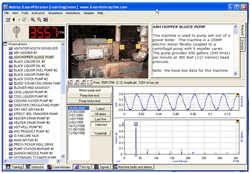
You need to view historical data so that you can see first-hand how the vibration patterns change as faults develop. You also need access to real "live" vibration data, straight from the machine. The case histories module provides a library of fifty machines with historical and live vibration readings, complete with reports and pictures.
You can analyze the vibration graphs in our software, or you can "play" them into your data collector, and analyze them with your own system.
 Sharpen your skills with additional practice Sharpen your skills with additional practice
Another way to gain some measurement and analysis experience is with our "virtual" test rig (also known as a fault demonstrator).
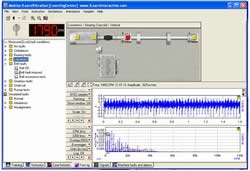
We have set it out of balance, we misaligned the gears, we installed bad bearings, and much more, and then recorded vibration at a number of points on the rig, in three axes. All you do is select the fault condition, select the test point and axis, and the data is yours.
You can analyze the vibration on screen, or play it into your data collector.
Imagine, a test rig that can be set up in seconds, with great data every time - and no skinned knuckles!
 Build a strong understanding Build a strong understanding
To ensure that you are using your data collector properly, and to help you perform special diagnostic tests, it is important to understand "signals" and "data processing".
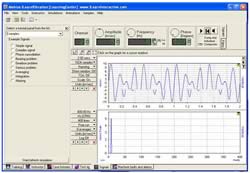
By turning a couple of knobs, you can build signals and study the waveform and spectrum. And via the tutorial panels, you can easily study more complex issues like modulation and beating, and data processing tools like windowing, resolution and averaging. You can do it all on the Signals tab.
These topics are all covered in the training, but there is nothing like having free access to the tools to experiment by yourself.
 Understand the source of machine vibration frequencies Understand the source of machine vibration frequencies
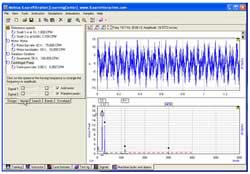
One of the keys to spectrum analysis is understanding the relationship between the machine and the peaks you see in the spectrum. We have created a machine modeler - you simply drag-and-drop the machine icons and build the machine. The frequencies are calculated and the vibration is simulated.
You can then experiment with band alarms and envelope (mask) alarms in order to better understand how they work (and their limitations) - and to see how they should be designed for a more complex machine.
| Standard Edition | Web Based Edition | Corporate LMS Edition | Professional Edition | Pricing |
To ORDER or for further information, please call us at 414-218-8088 or
E-mail: jim@jlgriffin.com |


 Case histories build experience and confidence
 Sharpen your skills with additional practice
 Build a strong understanding
 Understand the source of machine vibration frequencies


